
Ideate
Categorization of Ideas
Affinity diagram
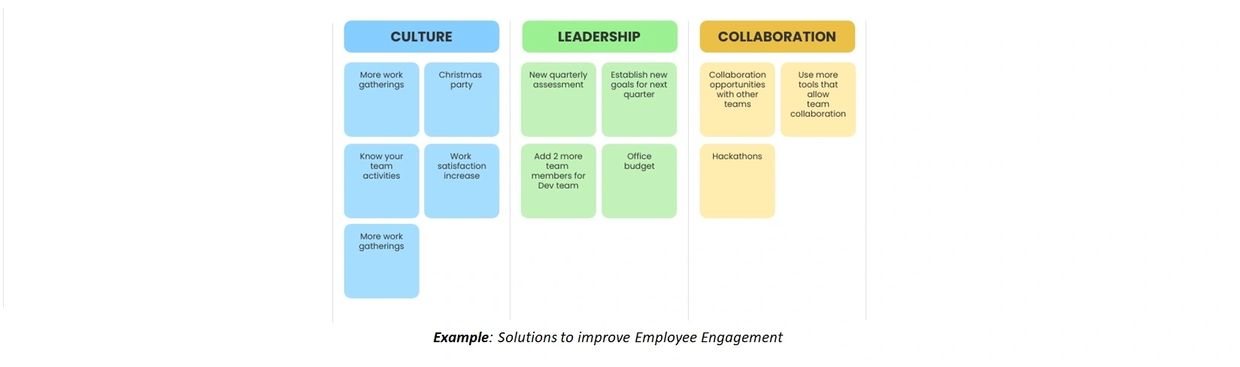
An Affinity diagram is a tool that is used to organize data gathered from a brainstorming session, research, meeting, etc. under meaningful categories that are based on common relationships or themes. These themes are referred to as affinity sets or affinity groups.
Each ideas of solutions are clustered based on the similarity and then put a category name to each group. This helps conducting more focused and clear discussions among the participants during the next steps.
Dot Voting

Dot voting is a fast and easy polling system used to bring out a group's opinions regarding the highest priority items on a list. The technique is called “Dot Voting” as the votes are cast by placing a sticky-dot or using markers to make a dot next to an item posted on the wall.
The solution ideas under each of the categories are prioritized through Dot voting. Each voters are given sticky-dots (in offline mechanism) or online voting option. The solution ideas are prioritized based on the number of Dots or votes. In another variation of the dot voting, the voters are given different color dots (each representing different rank). The ranks are also considered to take final decision on the priorities.
Dot voting is beneficial for a multitude of reasons:
1. It prevents the HIPPO (Highest-paid Person's Opinion) effect and enables all participants to contribute equally.
2. Expertise (and opinions) converge in a productive, time-efficient manner.
3. Narrows down alternatives to focus on a few prioritized options.
4. It collaboratively creates a shared artifact that can be used to communicate decisions.